A classic story arc and the run-in: How the Blades made it to the Premier League

With Sheffield United promoted to the Premier League, we can safely reflect on how this was achieved. But also how with four games to go it felt like it had slipped from our grasp.

It’s true, just as the story arc beloved of so much on-screen drama likes to pitch us into a trough of despair before the final act, with four games to go something of a crisis had descended on Blades fans.

A drama-filled last 10 minutes against Millwall the week before Easter dumped United out of the automatic promotion spots, and looking like we needed to win all remaining games.

Question marks loomed over whether “our” way of playing was something we could still do. Was it spent, “sussed out” by opponents?

It turned out it wasn’t. Our heroes bounced back with on-the-spin wins that saw promotion clinched with a game to go.

But, what led to that pivotal point in our season?

Let’s recap how the season panned out from a numbers point of view and tactically.

Overlapping centre-backs

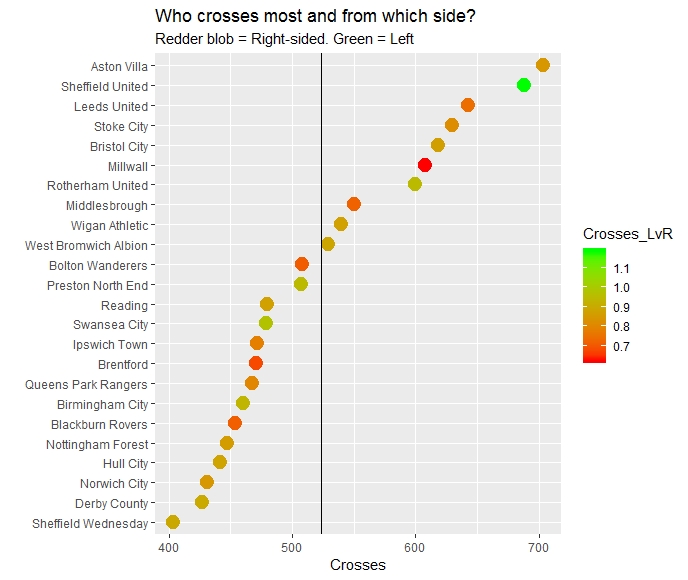
Sheffield United have become known for use of so-called overlapping centre backs.

That means any of the right and left CBs can end up in the opponent’s final third. Often that sees them helping out with build-up play high along the flanks and sometimes making crosses, or even getting on the end of them.

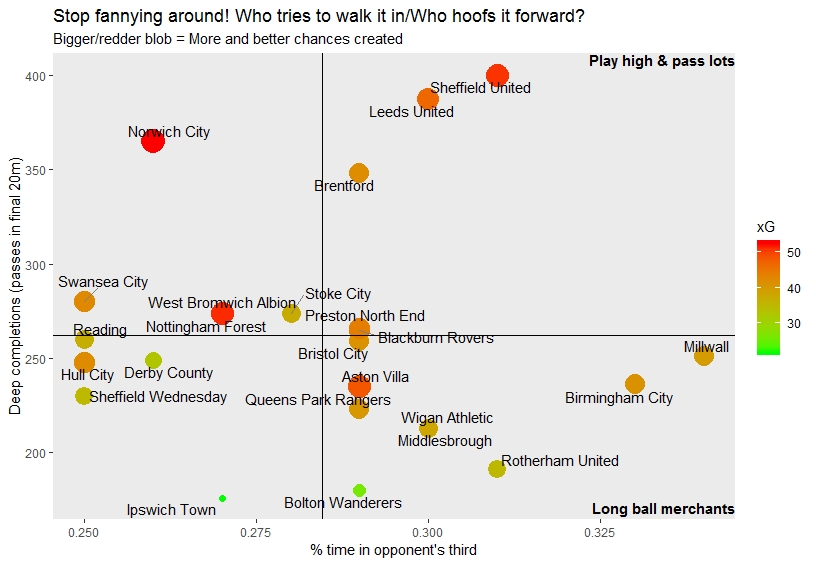
But, that part of our game has usually been an addition to the core style of Wilder and Knill’s Blades. That’s been built around lots of possession in the final third, starting on the flanks, with overloads created to unbalance the opposition before picking out a route to or near the six-yard box.

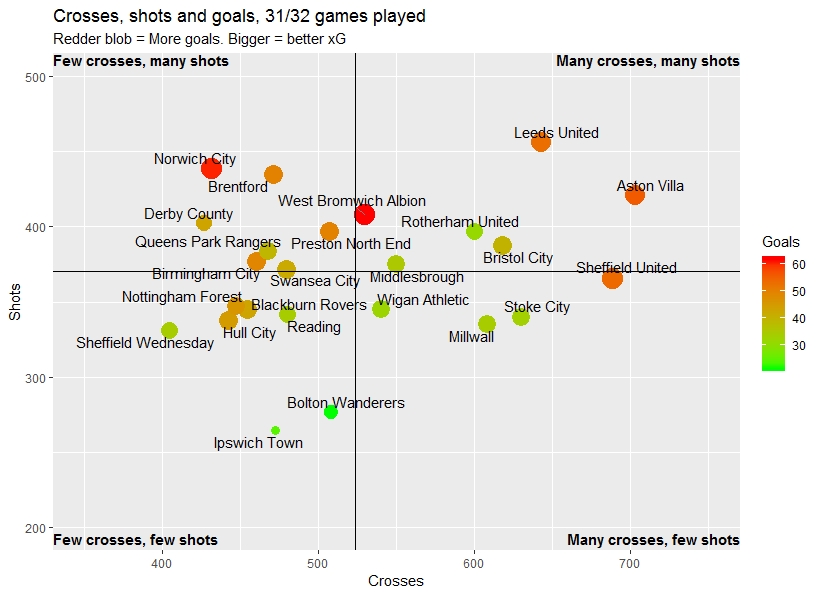
That seemed to be the only way we played until around Christmas. It had served us well. We were in the top six, but the streets of south-west Sheffield rang with cries of “We need to be more clinical”.

Back then, the Blades rode high in terms of expected goals – a score given according to the quantity and quality of chances created – but lagged behind when it came to actual goals.

On Christmas day United stood sixth. But, a similar air of gloom had descended to that which reigned after the draw with Millwall, after another 1-1 draw against a lowly team; Ipswich in that case.

Champions’ form

But what a transformation Santa brought us!

Up to 25 December average points-per-game (ppg) had been just over 1.65, with average goals-per-game at 1.57.

That improved massively. From the end of December to Easter our ppg rose to 2.15, which was champion’s form.

1xGvsG1

But, some numbers started to dip just before Easter. This came alongside some unusual and difficult games, and some changes in our style of play.

We’ll get to those numbers below. First let’s look at the games and performances in question.

New year, new United?

Since beating Reading 4-0 at Bramall Lane in mid-February there was a run of games that didn’t allow our trademark style to come to the fore. They included:

  • Grinding out a 0-1 win at WBA,
  • A cagey and tense 0-0 Steel City derby,
  • Defeating a 10-man ultra-defensive Rotherham 2-0,
  • Taking victory from an ultra-defensive setup when down to 10 men against Brentford (2-0),
  • Absorbing intense pressure, playing on the counter and beating Leeds United at Elland Road (0-1),
  • Slipping to defeat (2-3) at home to a Bristol City side that out-pressed and out-played us,
  • Bouncing back with a 1-0 win at Preston, before,
  • Two 1-1 draws in a week to Birmingham and Millwall.

Tactically, two things emerged from that.

One was what started to look like a plan B, and an ability to sit back and play a longer, quicker, more direct game.

The more direct way of playing often saw the pacier, more direct Kieran Dowell selected in midfield over Mark Duffy, who typified the play-high-and-pass-a-lot Blades of 2018-19.

The other thing was an increased solidity in defence, typified by the performances at Leeds and against Brentford.

1xGAvsA

We gave up only five goals in those nine games up to Easter. And when we measure goals allowed vs expected goals against for that period, the chart looks good – generally letting in fewer than the numbers said we should.

There were concerns at the other end of the pitch, however.

1PPG_GPG_etc

Last-10-game form up to Easter was still decent at 2.1ppg. Chop that down to the last eight and it became 1.88, which still wasn’t bad but spread over the season equated to more like third place in the league.

Meanwhile, goal-per-game figures declined since Christmas from 1.73 to 1.25 for the last eight games to Easter.

Despite being higher in the table, xG per game from Christmas to Easter was lower (1.42) than it was for the first part of the season (1.65), and over the last 10 (1.42), last eight (1.4), and last six (1.38) up to the Forest game that figure declined further.

And, in the 10 games up to Easter we only had better xG than our opponent on three occasions.

The big question, on the verge of the final act, was whether this decline in offensive capability was a reflection of the run of games and opponents faced. Or, was it that opponents worked out the Sheffield United way of playing?

A combination of these seemed likely, with fatigue thrown in sometimes too. But, it did seem at times that we struggled to impose our play-high-and-pass-a-lot style of play on opponents.

Even sides like Rotherham, Millwall and Birmingham found that clogging the supply lines to where we like to play effectively stifled our plan A. Our opponents clearly know how to stop us playing as we like to play. The question was whether they could. Would we do it our way or would there be a need for new tactical twists?

Did we do it our way?

We did.

The Blades came good at the right time.

United steamed home with 2.75ppg for the last four, with three wins and a draw. Meanwhile, a disastrous Easter weekend ushered in a Leeds collapse that saw them gain one point in four matches, for a startlingly bad 0.25ppg.

Successive United wins and clean sheets – less convincingly against Forest then in rampant form against Hull and Ipswich – saw second place secured with xG per game of 1.43 and xGA of 0.7 per game.

What emerged in the run-in was that some opponents clearly knew how to stop us playing as we like to play. The question was whether they could.

For the most part the answer was no, but it must be said that we had developed a new-found tactical flexibility as the season progressed.

The big questions now are which parts of that tactical toolbox will we see come to the fore in a much tougher Premier League and who will be the players to do it?

Rock, paper, scissors: Which Sheffield United will play at Preston?

(Written for Preston North End site, From the Finney)

I’m not certain what to expect from Sheffield United at Preston on Saturday.

A lot of that is down to the fact that I don’t know what to expect from Preston.

North End are one of the most improved, if not the most improved team in the Championship this season.

You can see that in this chart, which shows league position since January.

1. LeaguePos3Apr

The Blades have made a name for themselves – and achieved great results – on the back of a distinctive style of play under Chris Wilder and assistant Alan Knill.

Most well-known perhaps is that we have played with so-called overlapping centre backs. That means that any of the two right and left CBs can end up bombing forward to the opponent’s final third. Most often that sees them helping out with build-up play high along the flanks and sometimes making crosses (or even getting on the end of them!).

But, that part of Sheffield United’s game is usually an addition to the core style of Wilder and Knill’s Blades. That style is built around a lot of possession in the final third, starting on the flanks, with overloads created to unbalance the opposition before picking out a route to near the six-yard box.

This style has a definite preference for getting in close before making attempts at goal. United are among the most efficient in terms of shots-to-goals ratio in the division and among the lowest for shots from outside the penalty box.

You can see in this this chart that United are – averaged over the season – a team that spends a lot of time in the opponent’s final third and pass the ball a lot when they’re there.

2. TimeOpp3rd3Apr

That’s the style of play the Blades have become known for this season.

So, why am I not certain they’ll play that way at Deepdale?

Well, anyone who has watched Sheffield United in televised games recently may have seen very little that type of play.

That’s because there has been a run of games recently that haven’t allowed that trade-mark style to come to the fore.

Since beating Reading 4-0 at Bramall Lane in mid-February:

  • United have ground out a 0-1 away win at WBA,
  • taken part in a cagey and tense 0-0 Steel City derby,
  • defeated a 10-man ultra-defensive Rotherham 2-0,
  • taken victory from an ultra-defensive setup when down to 10 men against Brentford (2-0) and,
  • absorbed intense pressure, played on the counter, roughed up and beat Leeds United at Elland Road (0-1).

In other words, for quite a few games now the Blades have not played in the way we’ve become known for this season. Instead, Sheffield United have developed something of a plan B and an ability to sit back and play a longer, quicker, more direct game to take the chances that arise.

You can see from this chart that the number of passes made within 20m of the opponent’s goal line (aka Deep Completions) has declined since February for the Blades.

3. DeepCperGame3Apr

The more direct way of playing has lately often seen Kieran Dowell selected in midfield over Mark Duffy (who may well still be injured anyway for this Saturday). Duffy typifies the play-high-and-pass-a-lot Blades. Dowell is pacier – a 22-year-old Everton loanee – and suits a more direct style of play from deeper positions.

So, which Blades will we see at Deepdale?

If I had to bet I’d put money on the latter. Preston North End are the most dangerous and in-form club we now have to play on our run-in.

Playing away always tends to mean playing against a team urged forward by the home crowd, so I expect us to have to spend some time absorbing pressure and taking our chances when they arise.

But, I have no access to what Wilder and Knill are thinking.

And I often think how opposing managers approach a football match is a bit like a game of rock-paper-scissors. If one sets up one way and the other succeeds in stifling that, then it’s time to try something else.

The Blades are coming off a defeat to another in-form side (Bristol City, 2-3) in a match that was characterised by effective pressing by the Robins and full of tactical shifts and gambles (won by Lee Johnson).

Preston show up in similar areas in terms of pressing intensity and quantity and quality of shots as Bristol City.

So, on the face of it, I expect our forthcoming fixture to be similar as our last, but hopefully not in outcome.

But you never know. This is football. And we can’t say for certain what tactical setups our managers will pull out from behind their backs.

Antony Adshead tweets as @S2Stats


Chuck the form book out of the window? Not in Sheffield.

“It’s a derby, so you can sling the form book out of the window.”

That’s something we’ve all heard. But is it true?

It seems not, at least in the case of meetings between Sheffield United and Sheffield Wednesday.

In those matches form does seem to have had a bearing on the outcome, with the team that shows a form advantage winning more often than they lose.

And in this fixture that team has most often been Sheffield United.

Wednesday fans like to trot out the mantra – “older, bigger, better” – but the Blades have won the Sheffield derby more times than the Owls. They’ve achieved a higher average league position during the clubs’ league histories too.

In this article we look at detailed stats for the Sheffield derby since 1893, when both clubs first met as members of the Football League.

Since then there have been 115 league meetings, with United wining 42 times, Wednesday 36, plus 37 drawn matches. In those games the Blades have scored 157 goals and Wednesday 147.

1. Results_league1

The most frequently occurring scoreline is 1-1. That has been the result 21 times, followed by 1-0 (17 times) and 2-0 (10 times). Those scorelines account for about 41% of all Sheffield derby results*.

Wednesday’s 4-0 1979-80 Boxing Day Massacre and United’s 4-2 away win in 2017-18 have each occurred as scorelines only once. They were literally once-in-a-100-years events.

0-0 has only happened six times, so Jos Lukuhay has the dubious honour of achieving one third of them in two successive meetings at Bramall Lane.

2. Scoreline_league1

It’s hard to imagine a fixture competed in by two better-matched teams, looking at the historical sweep of things.

Average league position for all seasons since 1893/1894 puts United at 20.7 while Wednesday achieve 21.1. In seasons where the two have been in the same division United have an average league position of 16.2 and Wednesday 16.9.

3. League_pos_time_series copy3

There seems to be a clear home advantage, historically, with 50 home wins, 28 away wins and 37 draws.  United have been the home team 58 times, Wednesday 57. The number of home wins is evenly split, with 25 each, but United have a better away record, having won 17 (Owls 11).

4. HAD_league1

So, what about form?

Form has its drawbacks as a marker for performance. A particular form period could be about to end, or have witnessed peaks and troughs, for example. It could also reflect the strengths or weakness of particular opponents faced, but it seems a reasonable way of averaging performance over a given period.

In this analysis I took the points for each team on the eve of the fixture and what they had amassed six games previously.  From that I got a points-per-game average for the six games prior to the derby match. These were adjusted so that the three-points-for-a-win period matched up to the two points era. Then the form advantage for the team doing better, if any, was assessed, with an advantage of 0.33 points per game (PPG) over the other being considered significant.

By that measure Sheffield United came out as the form team on the highest number of occasions – 40 – compared to 33 times for Wednesday, and 42 times when both teams were within 0.33PPG of each other.

5. Formdist_league1

The number of times United have been the form team is close to the number of times they’ve won (40 vs 42). Meanwhile, Wednesday have been the form team 33 times, and won 36 times.

But, while the absolute numbers of times each team has been the form team bears some relation to the amount of times they’ve won, those occasions aren’t the same ones.

That would have been a neat outcome but reality is not that obliging.

However, form does have some bearing on the result and United have been the team with a form advantage – and pressed it home – a little more often.

As you can see from the chart, United have been the form team 19 times and won, 12 times and drawn, and 9 times and lost.

Wednesday have been the form team 14 times and won, 11 times and drawn, and 8 times and lost.

6. Result_form_league1

How much does playing home or away affect form?

We can see that form seems to have some effect on outcome. A look at the chart shows a correlation between having a form advantage and the amount of wins, draws and losses.

If we break down form advantage and result to factor in home/away, the result is less neat.

Blades wins – whether in-form, level in form or suffering a disadvantage – are mostly distributed around 60/40 home/away. United’s level form and in-form draws are in the same ball park.

Owls wins in general are more skewed towards the home venue, with a ratio averaging 70/30 for wins.

Another feature that stands out is the amount of times Wednesday have been the form team and drawn away (8 times against 3 at home).

7. Form_result_venue1

Can we draw any conclusions from all this?

Well, the Sheffield derby is clearly very closely contested, with the teams only a Brexit apart in terms of win percentage (52% to 48%) and less than half a percentage point difference in average league position over 115 years.

Looking at form, we can say the team with a significantly better last-six form record going onto the derby tends to win more often than not.

And, United fans can take comfort from a historical record that puts them on top more often when they have a form advantage and with the better away record of the two teams.

What about the next Sheffield derby?

At the time of writing (27 February) last six points per game form adjusted to the two-points-for-a-win used in this study puts United at 1.66 and Wednesday at 1.5.

That wouldn’t class as a significant form advantage in the study I’ve done here, and that probably shows the limits of last-six-game form on its own.

The two teams’ form is similar going into this game. The Owls have won three and drawn three, the Blades have won one more.

But drill down beyond that and the team’s those results have occurred against is quite different.

Wednesday’s good run has mostly been against teams in the bottom five plus mid-table Swansea and Brentford. The Blades meanwhile, have beaten two of the top six and drawn against table-topping Norwich as well as Aston Villa. It’s almost like the two teams have played different halves of the division.

So, can we chuck the form book out of the window?

No, I think it has a bearing, and we’ve seen that it has some effect on the outcome of games in the Sheffield derby.

But, it is also modified to a large extent by league position, home advantage and other factors, like who that last-six form has been achieved against, for example.

I can’t say for sure, but I’d guess form exerts a similar effect across all professional football.

I haven’t been able to run the same numbers on other derby games and other fixtures in general, and I’m not sure it exists in form that’s easily digestible for data analysis.  I had to collate results, league position etc and calculate form from publicly-available data, but there was no practical way of working out who each team had played in any of their preceding six-game periods to see what their form amounted to in detail.

If data for English football existed in a way that allowed those kinds of questions to be asked relatively easily it would open the way for a lot of interesting data analysis.

But never mind all that. What will happen next Monday?

I’d call next Monday’s match (4 March 2019) as a Blades away win. That’d be “Level and Blades” and away from home in the terminology of this study of the historical numbers, and an outcome that has happened six times out of 115 so far.

I’ll come back here and add the result afterwards, no matter how my prediction fares.

…………………………….

For those that are interested, when we look at league and cup meetings the figures are as follows:

  • SUFC and SWFC have been the home team 64 times each. (Owls once as ‘home’ team at Wembley).
  • Wins and draws: SUFC 45, SWFC 42, draws 41.
  • Home wins 56, draws 41, away wins 31.
  • Goals scored: SUFC 175, SWFC 168.

…………………………….

* A result of 1-1 has been the outcome in 18% of matches, 1-0 has been the result 14.5% of times, and 2-0 on 8.5% of occasions. That’s about 41% altogether.

To compare, in the Premier League between 2001-02 and 201-11 the corresponding percentages were 11.6%, 10.9% and 8.7%, making a total of about 31%.

That means the Sheffield derby has resulted in a 1-1 draw, 1-0 or 2-0 home win more often than has been the case in nearly 10 years of Premier League matches.

Teams that cross most don’t always score more goals. And why I find Norwich very intriguing

Some interesting findings off today’s EFL Championship charts, with 31/32 games played and Sheffield United set to face Reading tomorrow.

I ran a fairly simple plot on volume of crosses, added a column to calculate the ratio of right- to left-sided crosses and showed that via a colour code.

No real surprises about which teams get the most crosses in, with Villa and Sheffield United topping the table.

Rplot01

What does stand out about the Blades is the left-sided bias. But, that’s not really a surprise, more a satisfying graphical point on the chart.

What does surprise me is that Norwich — challenging strongly for automatic promotion — are in the lower reaches of the table for cross volume.

Not that that’s necessarily a bad thing. If you scan down the teams, there’s no league table-like order to the way they’re arranged. So, although there are some currently successful teams near the top, it clearly is possible to fling in lots of corners and not translate that into league success. See Millwall for proof of that.

Norwich might sit two places up from the quite un-penetrative Sheffield Wednesday in the cross volume stakes, but that’s not the full picture.

We can dig deeper here, by plotting crosses against shots.

Rplot

And that shows that the usual suspects —  Sheffield United, Leeds, Villa — occupying the right-hand end of the chart with lots of crosses and reddened points that show they score plenty of goals.

But, check the reddest, most goal-scoringest blobs on the chart and it’s Norwich and WBA, with relatively low cross volumes. What’s more, Norwich have bunged in something like 100 fewer crosses than West Brom.

It’s not the first time I’ve noticed Norwich in a strange position on the chart.

Recently, I started to plot amount of time in the opponent’s third against the number of passes made there.

This season, the likes of Sheffield United and Leeds are doing lots of both. Some other teams are getting to the opponent’s box a lot but not necessarily making things stick like the above two (see Millwall again).

Rplot02

Norwich stand out again here, with relatively low amounts of time in the opponent’s third but lots of passes when they are there.

Norwich look like a team that try to dictate play in the middle third. Then, when they get chance, go through the gears towards the opponent’s goal to exploit a less dense defence.

In other words, they create space where they want it: Right through Zone 14 and on to goal.

It’s an approach I’ve lightly obsessed about (see previous posts, re plan Bs etc). I find the idea of being able to shift/pull an opponent vertically and then get in behind quite fascinating and a potential answer to low block traffic jams.

That’s all assuming I’m reading things correctly.


All we wanted for christmas was to outperform our xG: And we got it!

In the run-up to the festive period Sheffield United were underperforming.

Don’t get me wrong, we were outperforming pre-season expectations and what we should be able to do with our wage bill, but we had slipped from our early season exploits and our points-per-game tally was down to about 1.3 in mid-December.

At the same time, the Blades as a team fell short of expected goals figures. Billy was exceeding his xG but no other striker in the squad came near.

I documented lots of those numbers and my thoughts about whether we needed a plan B in a previous blog post.

I’ll talk about that more in another post perhaps, but for now let’s look at what Blades fans got for christmas.

That present was that we over-achieved our xG, and that precisely what is needed to maintain promotion form.

As a team, Sheffield United went from 14th and three less goals than our xG to 8th, and exceeding our xG by about 3.5.

xgvsgp27

At the Sharp end, as it were, that was largely the result of two players performing brilliantly.

On the one hand, Billy knocked in four goals over christmas and new year. He was already exceeding his xG, but goes into game 28 with xG of 13.05 and 16 real world goals.

The big story, however, is David McGoldrick closing the gap between what the numbers say he should do and what he actually achieves.

I’ll admit I was beginning to think Didsy more of a creator (and a fast, skilled, exciting one, at that) than a converter of chances, but the recent run of games rubbed that one in my face.

Before christmas, McGoldrick’s xG (11.66 after 22 games) was better than Billy’s (10.21 after 22) but he’d only scored 6 goals compared to Sharp’s 10.

But, in late Dec/early Jan, Didsy netted four times to take his xG to 12.82 and real-world goal tally to 10.

bsdmcgxgg22-27

That run of results saw Sheffield United hit second spot in the table and 2 points per game in form terms.

So, to compare with chart I generated before christmas, after 22 games, here are visualisations for 27 games.

To start with, xG. Blades still keep good company.

xgp27

In terms of expected goals against (xGA) Blades have gone from fourth best to the best.

xgap27

That makes for good reading when it comes to expected goal difference, with Blades top of the table.

xgdp27

That wasn’t being translated into actual goal difference, and SUFC ranked 5th, however.

But, with 10 goals in four league games and only one in reply Sheffield United move up to 2nd in the Championship in terms of GD.

gdp27

The hope now is that we can sustain this progress for the coming months. This season’s Championship has seen the top of the table spots change hands many times. Will some clear contenders emerge, and can Sheffield United be one of them?

Sheffield United mid-season stats: A great start but need goals, pace and a Plan B

We’re 22 games into the season, with the all-important Christmas schedule to come.

I’ve crunched and plotted a few key numbers for the Blades season so far.

My verdict: We’re doing really well. Punching above our weight. But we need to exceed our xG and that requires more efficient conversion of chances, with more pace up top and a Plan B in our style of play.

First, the good news.

Blades are up with the best in terms of expected goals (xG).

xG bar chart 20Dec18

And we’re at the right end of the table in expected goals against (xGA).

xGA bar chart 20Dec18

And below, here are United topping the table in expected goal difference (xGD)

xGD bar chart 20Dec18.JPG

Then we translate things into actual goal difference and Sheffield United keep good company once more.

GD bar chart 20Dec18

“We need to be more clinical!”

OK, so that’s all good news. We’re doing better than most of us probably expected in terms of league position this season. And we’re doing it with high-pressure, attacking football that’s pretty tight in the defensive department too.

But when we compare what expected goals says we should be scoring and what we are actually converting, there’s a slightly worrying disparity. It’s one that might account for the calls to “be more clinical” we’ve all heard at some point this season.

Look at the table of actual goals scored vs xG. Four of the Championship top six exceed their xG. Only United and Boro haven’t. (Preston and Ipswich get into the top slots by virtue of doing well with relatively few chances, in case you wondered.)

xGvsG bar chart 20Dec18

Should we want to exceed our xG? Absolutely. It shows that teams/players are more skilled/expert at what they do. The top strikers in football – Kane, Messi, Aguero, Suarez, Ronaldo – regularly exceed their xG, often by big margins.

United have four players we’d recognise as forwards – Sharp, McGoldrick, Clarke and Washington. Only one has converted his chances at a rate exceeding their xG this season, and that’s Billy Sharp, with xG of 10.21 and 11 goals scored after 22 games.

Meanwhile, David McGoldrick puts up better xG numbers than Billy (11.66) but has scored just six, while Leon has not had a good enough run to attempt to match his xG-beating performance from last season.

Meanwhile, at the other end of the pitch we’re letting in more than we should, when we measure goals allowed against xGA.

xGAvsA bar chart 20Dec18.JPG

A distinctive style of play, but do we need a Plan B?

It has to be said, Wilder’s United have a definite way of playing. We top the tables in touches in the opponents box, and are clearly coached to head for the 6-yard box, or “Billy Sharp’s office” as I call it .

This plot clearly shows that, with United leading the Championship in touches per shot in opponents’ penalty areas.

Championship average is about 0.46 shots per touch. United average 0.36 shots from the box per touch in the box – that’s nearly three touches per shot – with relatively few punts from outside the box.

Meanwhile, counter-attack kings West Brom average 0.53 shots per touch in the opponent’s box.

TIB_vs_SIB_plus_shots_and_OOB copy.jpg

The plot above is what the Blades style of play so far this season looks like.

And it has served well. With the addition of more efficient goal conversion we could get back to the levels of deadliness in front of net seen earlier in the season (the Villa game, for example).

That might come by coaching, by players (like Washington) getting a better run, or by additions during the January transfer window.

An injection of speed would also allow for development of a plan B. The plot above shows the United are very distinctive in terms of pushing into high percentage areas, and playing high-tempo passing football.

It has worked, maybe more so during the first half, but often we seem not to be converting that possession in dangerous areas. And then we often also see a dip in the second half with our attacking 2-3-5 pinned back to a 5-3-2 with an outnumbered midfield and no outlet for an embattled defensive line.

I wonder if the latter is a consequence of the former. That is, that playing at such a high tempo early on leaves players fatigued, then prone to mistakes.

It certainly felt like that during the WBA match. If the the Baggies aimed to let us wear ourselves out in the first half – knowing perhaps that we sometimes struggle to convert territorial superiority into goals – and then hit us with sucker punches in the second, it was a plan executed to perfection.

So, I also feel like we need a plan B. One that allows us to play deeper. It often feels like there isn’t an in-behind for United player to play into, and that we don’t have the players that could really exploit it.

So, looking forward to the transfer window, we won’t get the likes of Dwight Gayle or Tammy Abraham at the Lane but perhaps we can hope for someone that can help build on what has been achieved so far this season.


Who are the Championship’s corner kings so far this season?

So far, it’s West Brom, who have banged in seven goals from less than 100 corners, for a success rate of 7.07% .

Least efficient are Nottingham Forest, with one goal from 103 corners, for a 0.97% success rate.

The average is 2.71 goals per every 100 corners. Scroll down for your team’s numbers.

Sheffield United top the table for sheer volume of corners (173), which is testament to how high they play around opponents’ penalty areas. But their success rate is below average, at 1.73%.

Corners plot copy

I made this plot from data released on Twitter by Stuart Reid, a set-piece analyst/coach who goes under the handle @From_The_Wing

While I think this is interesting, I do wonder if this is too small a sample size to draw too many conclusions from. With a range of just six goals, it wouldn’t matter how well-rehearsed your corners are for a couple of bits of luck either way make a big difference to these standings.

Corners numbers grab

Shots vs saves for Championship keepers: Who tops the tables?

Who’s the best shot-stopper in the Championship?

Right now, after 21 games, it’s Middlesbrough’s Darren Randolph.

If we measure shots saved against shots faced, Randolph has an 80% success rate.

At the other end of the table, Ben Amos, on loan at Millwall from Bolton, has stopped about 53% of shots aimed at his net (in 12 games). Scroll down to see those percentages in a table.

Average save percentage in the Championship is about 67%.

But can we tell how good a ‘keeper is from those figures? Not really. It’s not the whole story.

Here’s a pretty scatter plot that stars to give a clue about relative performance of goalkeepers.

Keepers plot abline xGAIn general, the more to the right and below the line a ‘keeper is, the higher his save ratio. And as you can see, those that play for clubs that are higher in the Championship are generally the ones that occupy those parts of the chart.

But there are some outliers. Namely, ‘keepers that appear to be putting in massive performances in very difficult circumstances.

First is Anssi Jaakkola at Reading with a save percentage of 76%. Next is Marek Rodak at Rotherham, on 73.5%.

Not only are these two saving way above the average number of shots against them. They are also doing it for teams that give up a lot of shots in high percentage areas.

To show that, I have also factored in total team xGA (expected goals against) to give an idea of the quantity and quality of shots given up by a goalie’s team.

So, the size of the point shows that Jaakkola and Rodak generally face shots of high quality, and a lot of them too.

Meanwhile, Darren Randolph’s Boro team – exhibiting “the Pulis effect” – are masters in restricting opponents to low percentage shot areas, making his table-topping 80% save ratio look a little less hard-fought.

Are there any outliers in the other direction? If any, Orjan Nyland at Aston Villa is a contender.

Keepers bar chart 17-12-18

Most of his fellow ‘keepers are in the better-than-average zone, whereas his save percentage is just about bang on the mean at a club with about average xGA for the division, but I’d guess that Villa’s free-scoring style both accounts for that and lessens its effect.

Having said all that, I’m not able to give the eye test to all these conclusions. It’d be good to hear from fans of other clubs about whether the numbers ring true.

Even if they’re not the greatest measure of a keeper, I think they can say something about team performance and playing style.

Table 17-12-18