Sheffield United season so far: A quick brain dump.
The wheels came off early for Selles, if they were ever even on. The gap between chances created (xG) and allowed (xGA) had widened dramatically by a month into the season. Wilder’s return saw that gap keep getting wider, but then the international break really helped, perhaps with time to coach a system, roles etc.
But, while the gap between xG and xG allowed has narrowed, results haven’t really come. Mistakes have happened to allow goals, and we haven’t appeared massively likely to score.
What’s going wrong there?
While we lead the division in penalty area carries, we lag when it comes to passes in the box and crosses. Bear in mind that those division averages flatter most of the rest of the teams, some of whom will be often dominated, or will play on the counter and never rack up much possession in the opposition box.
What Wilder and Knill teams were good — sorry, absolutely fantastic — at in their heyday was keeping the ball in wide areas of the final third, with an overload, until the opportunity came to put a ball through and in behind the opposition, with a cross / cutback (and goal) often resulting.
Lately, it seems there’s no attempt to play like this. All too often if a player progresses the ball in a wide area* he does it alone and there’s a wall of 3, 4, or 5 opposition players between him and goal and no clear passing lanes to team mates.
Assuming we want to play as a team that progresses the ball through the thirds and to make possession in the final third count, what needs coaching is ball retention out wide that can create incisive balls into the danger area and good chances. Along with this we need the nous and mobility to switch the point of attack between flanks.
(*That’s when we’re not trying to batter our way through the most crowded areas of the pitch in and around the penalty area ‘D’ where we often lose it.)
Alan Partridge famously warned, “Stop getting Bond wrong!” I haven’t done that, but I have been getting zone 2 wrong. That’s because I didn’t know where it was.
Last week I posted this as a brain dump of things I’d been thinking and talking about recently.
It’s based around the five zones commonly found in the likes of Garmin, Strava etc and which are based around heart rates and percentages of your supposed maximum.
But all that heart rate stuff is really just a proxy for what’s actually happening elsewhere in your body.
The practical conclusion of this was that I tested myself for my actual aerobic threshold and have started doing runs and bike rides based around it. I’ll stick to it and see what – if any – difference it makes over a couple of months.
Why though?
Zone 2 training should be about 80% of your weekly exercise.
That’s because it trains your body to work efficiently at aerobic levels of intensity. It creates mitochondria – the body’s little energy processors (pictured below) – and builds capillaries around the muscles.
The theory is that if you train your body to adapt this way you build big endurance, gradually see more efficient use of oxygen, get faster, get tired less sooner etc.
And the slow-twitch muscles it trains work better when you work at high intensities because they can process lactate better.
How to not get aerobic threshold, wrong
My light bulb moment about how to gauge aerobic threshold came watching Dr Inigo Millan – sports metabolism expert and trainer to pro cyclists. He said he often does phone meetings while doing ‘zone 2’ training.
His explanation of where to find the aerobic threshold made perfect sense, namely where those on his call know he’s exercising but he can still speak in full sentences.
So, I went out for a run and did that (minus the actual meeting) and found my aerobic threshold to be about 10bpm below my Garmin zone 2.
It got me thinking about how really there are only three zones and what they represent.
Low intensity, where slow-twitch muscles run on fat stored in the muscles.
Medium to high levels of intensity where fast-twitch muscles kick in and fat as a fuel begins to be supplemented by the carbs they need. That also means oxygen is needed, CO2 has to be expelled and increasing amounts of lactate are produced. As you go harder things edge towards levels of lactate that your body can’t process for long.
A very high level of intensity that you can’t sustain for very long at all.
That also means that between 1 & 2 and 2 & 3 there are two thresholds.
The aerobic threshold, where your use of fat and carbs as a fuel source tips towards the latter. Here’s where your breathing gets heavier as more oxygen in / CO2 out etc is required.
The lactate threshold, where your ability to process lactate falls below 45 minutes or so. I guess that’s arbitrary but it coincides roughly with a 10k run time.
What I plan to do
Lately I run 2x per week, in between 3x bike rides, all on weekdays with the weekends off.
I’ll keep those runs at or below aerobic threshold over the same route for at least 4 weeks and see if I get any quicker.
I’ll keep most bike rides down at that HR as much as I can, at least for the first part of rides.
I’ll train at lactate threshold levels or above on other days or at the end of aerobic threshold runs/rides.
At some point also I’ll test for lactate threshold so I know where both my boundaries are.
Although this is titled to target VO2max, it concisely sets out a good balance of training
Training zones correspond to a percentage of your maximum heart rate (and/ or power in cycling but that’s another subject).
At different levels of exercise intensity your body uses different energy sources and different muscle fibres and can continue for varying lengths of time before failure, also depending on your level of training adaptation.
So, training to a heart rate (zone) is a good way of training the body to be more efficient in any activity that involves some kind of endurance (ie, anything more than a very short sprint). It targets what we know the body needs to get better at to be fitter.
What do the zones mean in terms of effort?
Zone 1 – easy, ‘conversational pace’ – up to 75% of maximum heart rate
Zone 2 – harder, talking less easy – 75% to 80% of max HR
Zone 3 – getting harder – longer more sustained ‘tempo’ efforts – 81% to 88% of max HR
Zone 4 – hard but sustainable for about 60min for a fit person – 88% to 92% of max HR
Zone 5 – all out – not sustainable for very long – 93% to max HR
What do the zones mean in terms of how the body works?
In the lower zones – up through z2 and into z3 – you are more reliant on slow-twitch muscle fibres and use of fat stores in the muscles as an energy source. These are the aerobic zones.
As your heart rate increases and you go up through z2, z3 and into z4 you start to use more fast-twitch muscle fibres. These rely on glycogen (sugars, basically) as a fuel, and produce lactate. Lactate is also an energy source, but your body needs to be trained to use it. So, as you cross into z4, that’s called the lactate threshold.
If you’ve ever had that feeling, when running fast or cycling hard and everything is starting to hurt, and/or your limbs are heavy and you can’t get going, you’ve probably maxed out on the lactate your body can process.
So how do I get fitter?
To get fitter, to be able to keep running, run faster, climb hills on your bike, climb more hills to get home etc, you need two things:
A good ‘aerobic base’.
That means lots of z2 exercise. Most – about 80% – of your week’s exercise should be in z2. That’s because you want to train your body to work well aerobically. There’s also a spin-off benefit for harder work, as we’ll see.
To increase your lactate threshold.
That means a smaller amount – up to 20% per week – of exercise in z4. Start with intervals of a few minutes with lower intensity breaks between them. This trains your body to deal with lactate. The side benefit of z2 training is that your slow-twitch muscles help that process so a good aerobic base helps all the way up through the zones.
What are my zones?
First you need you maximum heart rate. A ball park figure is 220 – your age.
So, if you’re 60 it is 220 – 60 = 160.
That means your zones are:
Zone 1 – 68% – 75% of maxHR = 109-117bpm
Zone 2 – 75% – 80% of maxHR = 118-129bpm
Zone 1 – 81% – 88% of maxHR = 130-140bpm
Zone 1 – 88% – 92% of maxHR = 141-149bpm
Zone 1 – 92% – maxHR = 150-160bpm
And then you need a smart watch like a Garmin (or bike computer on the bike) where you can see your heart rate as you exercise.
What is a sample weekly training plan?
Low intensity (z1 and z2) for most sessions (easy jogs / runs or cycling for 30-60min per session).
So, if you exercise 4x a week, base 3x of them around this.
How to target that zone? Try not to go above zone 2 on your smart watch.
Higher intensity exercise in the other 20% of the week.
EG, cycling up hills that push your heart rate to z4. Or, interval runs of eg 400m intervals at 10k pace with 3 min jogging or walking rest between.
How to target that zone? Zone 4 on your smart watch.
What went wrong? I tried to run / cycle in zone 2 and I just couldn’t keep my heart rate down.
It takes a little while to build aerobic (ie, z2) fitness. Regular exercise in z2 will pay off after a few weeks as your body adapts to working at that intensity.
Don’t do any high intensity work until a month or so in. Focus on z2 training and you’ll be amazed at how your body adapted after a few weeks.
Lactate builds up in your body as exercise intensity increases. It’s actually an energy source generated when you use fast-twitch muscle fibres. Processing it is your body using it as an energy source.
If you’ve ever played football and got to 30, 40 mins in and you feel heavy and just not fresh, that’s because lactate has built up that your body can’t use because it’s not trained to.
It’s not something that’s going to concern most people in grassroots and recreational football, and maybe even more competitive lower-level football. Most people want to turn up and play, do the odd sprint, score a worldy and go home. And lots of people — including footballers — don’t like running. Fair enough.
And this kind of training is hard. You will suffer as you do it. But it’s worth it because once you’re fit you’ll be way less tired during games, you won’t grind to a halt, you’ll get where you need to, and you’ll grind down your opponent.
To get better at processing lactate (to stay fresh for longer) you need training runs that do two things:
Run at a pace and heart rate that pushes you to your limit of lactate processing.
That’s about 90% of your max heart rate. Once you’re fit you should be able to maintain that for about an hour, or near to. But you can also do intervals to build up to it.
Run at a slow pace at other times because that develops slow-twitch muscles, which are the ones help process lactate as it is created.
Running slow is 70% to 80% of max HR.
A sample training plan for football endurance
10 weeks duration. You will feel benefits after 2 or 3 weeks but you should aim to complete the 10 weeks. Playing football with recovery runs in between should maintain things after that.
You need an idea of your max HR. Usual formula is ‘220 – age’.
You need to be able to see these on your fitness tracker watch as you run:
90% of your max HR
A screen that shows ‘Lap distance’ and ‘Lap pace’.
3x per week training plan
1x 10k run per week (eg, Totley Tesco and back), staying at 90% of max HR all the way through. Remember what pace you ran at.
1x per week intervals. One week one go somewhere where you know the distance and can measure off eg 500m (eg, the block Broadfield Rd / Saxon Rd is 550m). Decide on a target pace. Take your 10k pace from above and knock 10 or 15 seconds off it.
Run one interval at that pace. Rest for two minutes. Repeat until you’ve run 10k in total.
Then make it harder each week by running at that pace for longer. See below for a suggested progression
1x ‘recovery run’ (at least). That’s 5k, easy / aerobic pace – 70% to 80% of max HR.
We’ll also assume that there’s football training and games in your week so you’d get plenty of fairly low intensity jogging (plus some sprints etc too).
Here’s a possible weekly plan:
If it was pre-season I’d suggest more recovery runs during the week.
10 week lactate fitness interval progression To make it progressively harder over the 10 weeks add intervals together. Something like:
Week 1 – run 10 intervals of 1,000m
Week 2 – run 1x intervals of 2,000m plus 8 intervals of 1,000m
Week 3 – run 2x intervals of 2,000m plus 6 intervals of 1,000m
Week 4 – run 3x intervals of 2,000m plus 4 intervals of 1,000m
Week 5 – run 1x interval of 3,000, 3x intervals of 2,000m, and 1x 1,000m
Week 6 – run 2x interval of 3,000, 2x intervals of 2,000m, and 1x 1,000m
Week 7 – run 3x interval of 3,000, and 1x 1,000m
Week 8 – run 1x interval of 4,000, and 2x 3,000m
Week 9 – run 2x interval of 4,000, and 1x 2,000m
Week 10 – run 2x interval of 5,000.
(NB, this was originally written as a training plan for my U17 footballing lad. He has the time and recovery capability to do this . . . in theory. Your mileage may vary.)
I’ve long thought you don’t necessarily get good at things by just doing those things.
I mean, for example, no musician would expect to play gigs by only ever playing gigs. Things involving motor skills need a lot of practice, in particular using repetition, focussing on difficult sections etc.
Likewise in football, I don’t think you get good at the game by only playing matches. There are things in football you just don’t do enough times during a game – or even at all in some games – to provide the repetition needed to make them habitual enough to stick.
I also came to the conclusion that if you want to be as fit as you can to play football, you need to do more than play football.
That came from my experience as I ran more frequently and played football once a week. As I ran more / more intensely, football got physically easier.
I had got into running again over lockdown and settled on 10km races as something I enjoyed — if that’s the right word — and from late summer 2021 trained for a few races in succession over the winter months.
So, my weekly schedule since around late summer 2021 has been something like:
Monday: Football (5- to 8-a-side)
Wednesday: Running 8km to 13km, at around lactate threshold heart rate (LTHR).
Friday: 10km training, usually intervals/repeats at target 10km race pace. This tended to be at LTHR and above.
What I found was that during weekly recreational football I tired a lot less. I ended games a lot fresher than I used to. I didn’t run any greater distance in games (I average 4.5km in 60 minutes), but I didn’t seem to hit that wall where there was no gas left in the tank.
How could I measure this?
I looked at Strava heart rate zone data for games. As a snapshot, it seemed to confirm football was easier than running for an hour.
This would be a fairly typical HR zone chart from Strava for Monday football. ‘Time’ is moving time:
But this kind of HR zone profile would be typical for a running or running training session:
It seemed to confirm that the effort required to play football felt nothing like the effort required to run at a decent pace for an hour or so.
Obviously, those are snapshots so I tried to look at the numbers over time, and downloaded my Strava data.
I wrangled the data to ID the football sessions and label them so I could compare Strava relative effort (RE) logged during runs and during football. Strava RE measures exercise by duration, intensity etc to give it a score so that different activities can be compared.
The result seems to confirm what I expected. That is, over the last year as I ran harder during running sessions, the effort recorded during football trended downward.
There are lots of potential caveats, and one I wanted to check was distance. Was I covering the same distance in my weekly football sessions?
Here’s the chart. There’s a slight decline in the session distance trend line. Some of the low ones (the lower points in October) are accounted for by not switching my watch on, for example, and one session the day after a 10km race. But there’s a clear tail-off in the effort expended too, as indicated by the points fading from red to green.
Conclusions
What I think has happened is that “being fitter” as a result of running during the rest of the week, translates to improved lactate threshold. That’s the heart rate beyond which your body ceases to successfully shunt waste products from your muscles. Once you’ve got to it, and pushed over it for a while, that’s when you feel the tank is empty.
Running at it or near it for an hour at a time pushes that threshold to higher heart rates for longer.
That kind of exercise seems to have prepared me well for an hour of football that demands nowhere near the same levels of sustained effort.
Has my football got better? I think so. But as a result of running, it could only be in terms of fitness and not being as easily fatigued. In other words, endurance at relatively high HR only enables any base technical skill that already exists that might otherwise fade with tiredness. I’ve not turned into Messi. Just a more mobile old hoofer that can go on for an hour without tiring.
Do I get out of breath? Yes, early in a game. No training prepares you for the ‘oxygen debt’ the body suffers as it tries to move from one steady state of effort to another. But once through that I find recovery is quick or barely required and I don’t get that feeling of the tank having been drained, at least over an hour.
Would this work for everyone?
Your mileage may vary. My circumstances are not everyone’s. I’m 58, and play low-level recreational football once a week. I’ve played on and off for years and this has been a way of getting fitter to play with people who are often half my age, and to leave enough recovery days during the week in between exercise. Other rec players may not have the time, desire or need to do what I do. Some might have different needs. A skinny youngster — or not so youngster — might spend their time better building muscle, for example.
And those that play at much higher levels would have pre-season training to provide roughly similar effects — an ‘aerobic base’ — but then have to sustain playing lots of matches at high intensities during the season, and to avoid injury.
But for an average rec player that wants to improve their fitness? It worked for me.
Is it possible to pin it down to one or very few key stats?
Maybe. In this case I’d say it’s getting the ball into the final third and keeping it there. Or the lack of it. And it looks like three key players – two injured, one not – are at the core of the issue.
If we look at the numbers of balls into the final third delivered by Blades players since the beginning of last season, a few big contributors stand out.
They are:
Oli Norwood, who led the pack with nearly 11 balls per game into the final third in the first half of last season.
Jack O’Connell, who sent about 7.5 per game into the opponent’s defensive third.
Enda Stevens at just over 6 per game
John Fleck with 5 per game, and
Chris Basham.
The obvious thing is that three of the main producers of balls into the final third have hardly played this season, either by injury or lack of selection.
And I would argue we have sorely missed that particular contribution from Norwood, O’Connell and Fleck.
Other players have gone some way to try and make contributions in this sense – hats off to the often maligned John Lundstram, as well as Sander Berge and Ben Osborn, and even John Egan – but these players can’t replace the quarter-backing skills of Norwood and O’Connell or the penetration of John Fleck.
Why balls into the final third?
To get why I’ve settled on that metric as important, we have to look at some of the other key measures across the two halves of last season and this one.
xG/xGA shows poor outcomes
First off are the more obvious ones, namely expected goals per game (down), expected goals against per game (up). These correspond loosely with shots for and against. They tell us more about outcomes at each end of the pitch and not really about what causes them.
Possession down but system still there
When we look at absolute amounts of possession per game over the three periods there’s another clear decline in the amount of ball we’ve had.
When we’ve had the ball we’ve been about as successful as ever in passing it, and we’ve had touches in pretty much the parts of the pitch we always have done since promotion. IE, pretty high up the pitch. In fact we play second highest up the pitch in the Premier League based on an average of where we take touches of the ball. The problem is that we are getting far less of them than we used to.
Possession down, but penetrating possession down even more
When we look at the decline in touches of the ball and passing it has dropped by about 10% since the beginning of last season. That’s the same for touches in the final third and in the opponent’s box.
But balls into the final third are down more than that – by about 20%. So, when you look at the players who deliver those the most – Norwood and O’Connell in particular, it starts to look like a major reason for Blades’ poor performances.
Is Oli Norwood the answer?
If it was me I’d get Norwood back into the starting line-up immediately, and keep him there, probably with Osborn and Berge also in midfield. It seems to me his quarterbacking skills are just too important.
Having said that, we lack Jack’s penetration into the final 20m. And there is also the missing Fleck. It might be that CW/AK need to work on an alternative line of approach up the left. But they eat, sleep and breathe this kind of thing so I’m sure they’ll have been working on it for a while. It takes time to coach a system that works.
What haven’t I talked about here?
The big one is the effect of the lack of fans in stadia. The numbers show United performed worse since the first lockdown. But coaches are taught to “control the controllables” and this is not one of them. There are plenty of things that are, potentially, as mentioned above, so CW/AK will be working on those.
Another thing is pressing, or defensive pressure in general. I’d like to run some numbers on this because United are currently second least pressing-est team in the PL (behind the tactically quite different Newcastle) and I am pretty sure that wasn’t the case last season.
Going by eye it looks like we’re pressing less, and less effectively, but I need to check that out.
Leaving aside the ridiculous ball-in-the-net-that-wasn’t incident . . .
Despite looking rusty as hell, there was a lot about Sheffield United’s performance at Villa that was familiar last night.
The key issue, however, was a failure to turn overall possession into something that could create chances.
The Blades had a lot of possession (53%), of which a lot was relatively high up the pitch (see average line stats left) and which resulted in a higher final third pass count than Villa (deep completions 20 vs 15).
All that is pretty familiar, as is the bias towards multi-pass sequences high on the flanks, especially the right.
But while the Blades had more passes than the opposition in the final third (20 vs 15), Villa had way more touches in the penalty box (23 vs 11).
That kind of stat — passes in the final third not being translated into passes in the box — was a familiar story for the Blades early in the season and I wrote about it here. The good news from that story was that Sheffield United had tended to become more direct, with touches in the box equalling or outweighing final third passes.
So, why didn’t United play as directly at Villa as we’ve been used to seeing? Numerous potential reasons:
Two left-footed players with a habit of penetrating play were missing (O’Connell and Fleck).
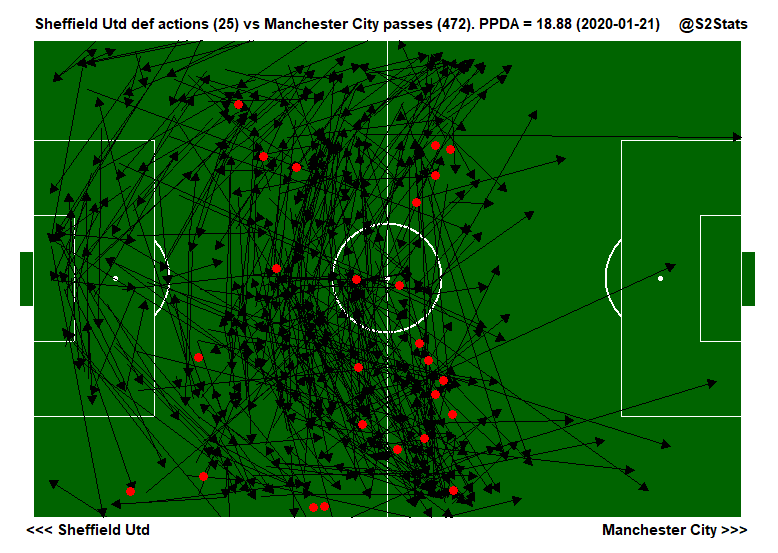
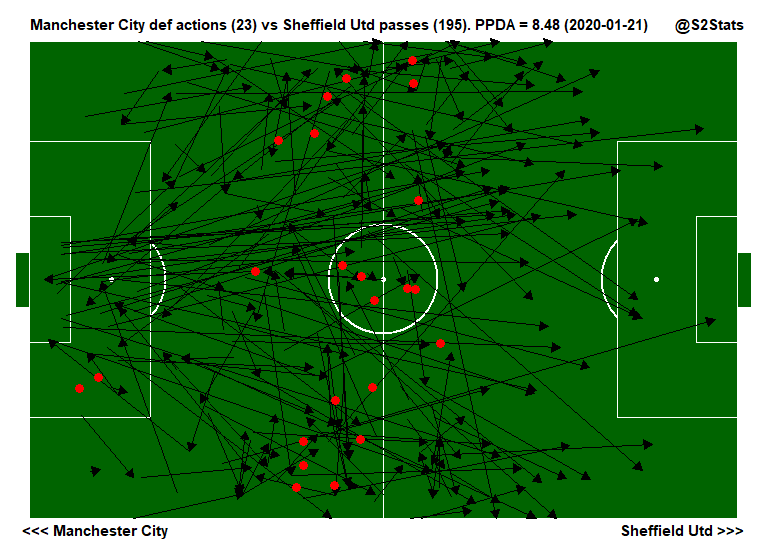
Not being able to play so directly against a Villa side that sat back rather than pressed high (see PPDA and defensive actions vs passes chart).
Whether that was lack of ability on their part and/or lack of home pressure pushing them on is a moot point.
Having said all that, many patterns of play were familiar if not as well-executed as we’ve seen previously and while many players looked less than fully match fit/sharp, there were some individual bright spots from the likes of Jack Robinson and Deano.
Pressing high up the pitch and PPDA These two maps show the attacking team’s defensive actions (red blobs) the opponent’s defensive 3/5 of the pitch plus the defending team’s passing. What’s clear is that only one side was committed to pressing high up the pitch. Villa generally sat back and waited for Utd.
The numbers show PPDA. That is, opponent passes per defensive action, all of which can be seen on the pitch maps.
With no chance of playing football or training, me and my U13 little fellah have been practising in our 5×5 bit of astro three times a week.
The aim of these training sessions is to maximise touches, using lots of surfaces of the feet and covering lots of movement patterns/body shape.
Key things to remember:
Repetition. Do a solid 2-4 mins of each routine at least
Good, clean control and touch. Get to know how it feels when the ball hits the right part of your foot.
Do everything with both feet.
As it gets easier try to go more quickly and do things more cleanly. Get your head up and do it by touch alone.
It’s not fitness training. We’ve been going for a run before doing this. Usually about a mile, or a bit less if we incorporate speedier sections.
It’s also no substitute for real football and all the awareness and decision making it involves. But it is a way to maintain some basic football movement and maybe improve a few things by trying to form new habits through repetition.
1. Dribbling with cones – outside of foot The aim here is lots of touches, using only the outside of the foot. Go for loads of little touches. It’s all about feeling the ball, being able to move it on in tiny increments, but also about making sure the foot that’s not touching the ball is getting to the right place.
2. Dribbling with cones – inside of foot As above but with the inside of the foot: Lots of touches and keeping the feet moving to where they need to be.
As a variation we add a lateral shuffle. You can use this to progress to Iniesta’s la Croqueta move.
3. Xavi cut This is a simple but basic escape move. Run one way then cut the ball back with the outside of your foot.
4. Cruyff Another escape move. Cruyff’s original was done from a static position. We call this a Cruyff but it’s basically a chop inside behind the standing foot. It forms the basis of lots of other moves, like the Ronaldo chop.
5. Soles The sole is a hugely useful surface of the foot to be able to use. As with a lot of these you may find one foot isn’t as good as the other. Transitioning from one foot to the other smoothly when changing direction feels like a challenge at first too.
6. L-cuts
A simple escape move. Bringing the ball back across the body
7. V-cuts
Similar to the L-cut but going behind the standing leg. Here we’re trying to do them in a ‘strict’ way, without moving around so that we can train ourselves to get the angles of the roll and touch from behind just right.
8. Receiving on the back foot
A basic football movement pattern. Give yourself a pass off the wall, open your body up and receive on the furthest away foot so you can send the ball on rapidly (or in real life touching it on for yourself). You can do this on your own with one wall. You just have to make a point of sending your first touch away (in different directions every time, preferably).
9. Passing square
Similar to the last one but passing to each other, receiving on the back foot, then passing. Getting a precise touch in a small area is a challenge.
It’s a great thing when something pops out unexpectedly from a plot. And even more so when it shows how data can help show the value of the less expected gems among players.
Here we have a plot of PL goalscorers that shows expected goals totals and volume of shots.
What struck me was how well grouped along the average line the highest scorers are. That was a benefit of colour coding for goals scored.
The question is begged, is that an accident?
I don’t think so. It’s because the most successful goalscorers don’t fire off shots wildly, but shoot from good locations.
Most of the PL’s top scorers are in the top right of the chart. That’s where you end up if you get lots of shots off and rack up a decent xG total.
Now, digging deeper into that top right quadrant you could be like Mohamed Salah, who has had the most shots in the league, but for whom the xG-per-shot ratio comes out as less than optimally efficient. You’d guess he’s been shooting from some low-xG locations.
The opposite is true for, eg Chris Woods, who tends to bang in headers from about 3 yards out. So, he gets a lowish shot count (playing for Burnley explains that) but high xG.
So, the guys with the red points strung out along the average line — Vardy, Aguero, Ings, Aubameyang, Abraham — are the ones that have struck a good balance between volume of shots and xG totals. They’re the ones getting into good positions to score, regularly shooting, and scoring.
Among them, Danny Ings is well worth taking note of as the only player from outside the top four (13th at the time of writing).
Playing for a club that’s struggled for big chunks of the season, and that has often meant struggling to get into goalscoring positions as a team, he has done remarkably well. It speaks volumes about his ability to fight for good goalscoring positions in quite adverse situations.
Whether that was by choice or simply because Man City have the ability to dominate possession and to keep the ball in our half/final third is impossible to say, but I suspect a good chunk of both was in operation.
As with the opposite fixture, and against Liverpool, the approach seems to be to not press high anywhere near as much.
The danger in pressing high as a blanket approach during a match against extremely high quality opponents risks the team being strung out the length of the pitch (although, of course, our transitions are fantastically rapid).
Instead, we seem to have often left their back line alone, which means an overload to us higher up, almost man-for-man in cases, or at least paying close attention to key opposition players (eg, De Bruyne on the night in question).


 Leaving aside the ridiculous ball-in-the-net-that-wasn’t incident . . .
 The Blades had a lot of possession (53%), of which a lot was relatively high up the pitch (see average line stats left) and which resulted in a higher final third pass count than Villa (deep completions 20 vs 15).